


Introduction: Reporting in Google Ad Manager Finally Caught Up With Reality
If you’ve been using Google Ad Manager for a while, you know the pain.
You want to check yesterday’s revenue.
Or see which ad unit lost fill.
Or understand why eCPM dropped in one country.
And suddenly you’re:
- Creating a report
- Waiting for it to process
- Downloading a CSV
- Opening Excel
- Cleaning columns
It feels unnecessary. Because it is.
That’s exactly why New Interactive Reports in Google Ad Manager exist.
Google has quietly rebuilt reporting to be faster, visual, and decision-friendly. Not just something you export and forget.
Yet many publishers still don’t use it properly.
This article explains:
- What Interactive Reports in Google Ad Manager actually are
- How to generate them step-by-step
- Why they’re easier than traditional reports
- How saving and scheduling works
- And how Monetiscope helps publishers turn reports into real revenue growth
Let’s break it down.
What Are New Interactive Reports in Google Ad Manager?
New Interactive Reports in Google Ad Manager are a modern reporting interface designed for live exploration of your monetization data.
Instead of building static reports, you can:
- Instantly apply filters
- Switch dimensions anytime
- Drill down without re-running reports
- See patterns visually
You’re no longer locked into one report structure.
Think of it like this:
Traditional reports are snapshots.
Interactive reports are conversations with your data.
Why Google Introduced Interactive Reports (The Real Reason)
Google didn’t add this feature for fun.
Publisher operations today are fast:
- Floors change daily
- Demand shifts hourly
- Traffic spikes unexpectedly
- Revenue leaks happen silently
Waiting for reports means reacting late.
So Google redesigned reporting around speed and interaction, not just historical accuracy.
This shift makes Interactive Reports Google Ad Manager essential for optimization teams.
How Interactive Reports Are Different From Traditional Reports
Here’s a clear comparison.
Interactive Reports vs Traditional Reports
| Feature | Traditional Reports | Interactive Reports |
| Data access | Static | Live & flexible |
| Filters | Fixed at creation | Editable anytime |
| Speed | Slow | Instant |
| Visualization | Spreadsheet | Visual charts |
| Drill-down | New report required | One click |
| Use case | Accounting & audits | Daily optimization |
This is why most AdX-focused publishers now rely on Interactive Reports for daily decisions.
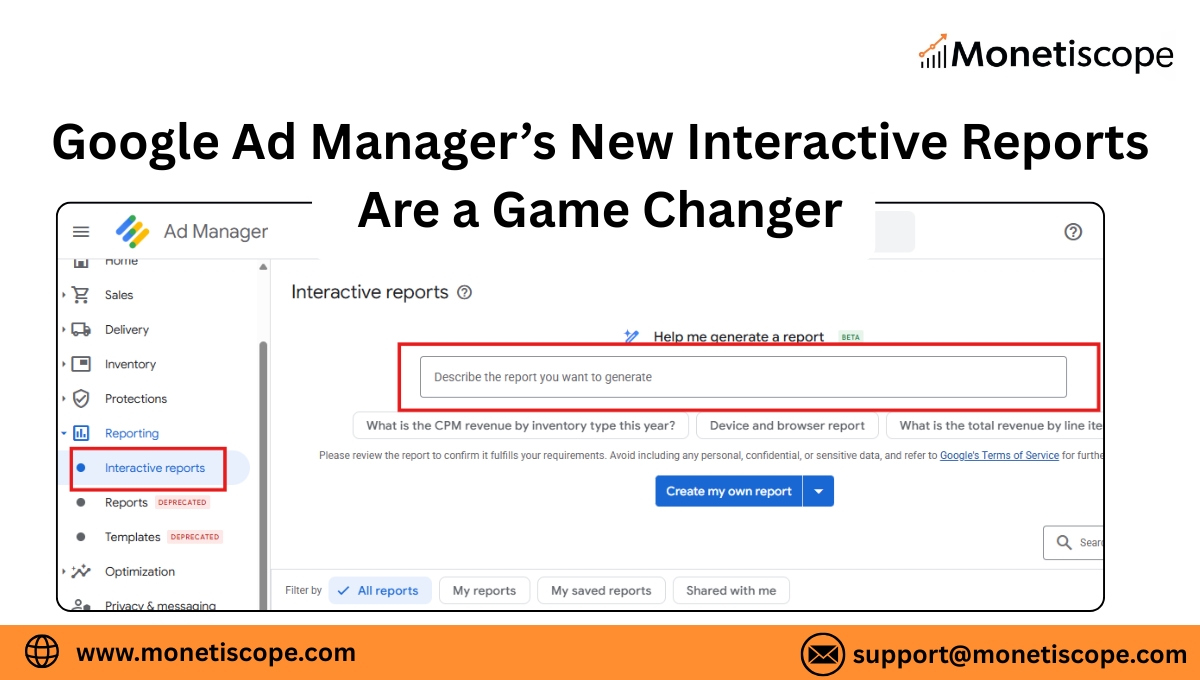
How to Generate Interactive Reports in Google Ad Manager
Based on the current UI (as shown in your screenshot), here’s the real flow.
Step-by-Step: Generate Interactive Reports
- Log in to Google Ad Manager
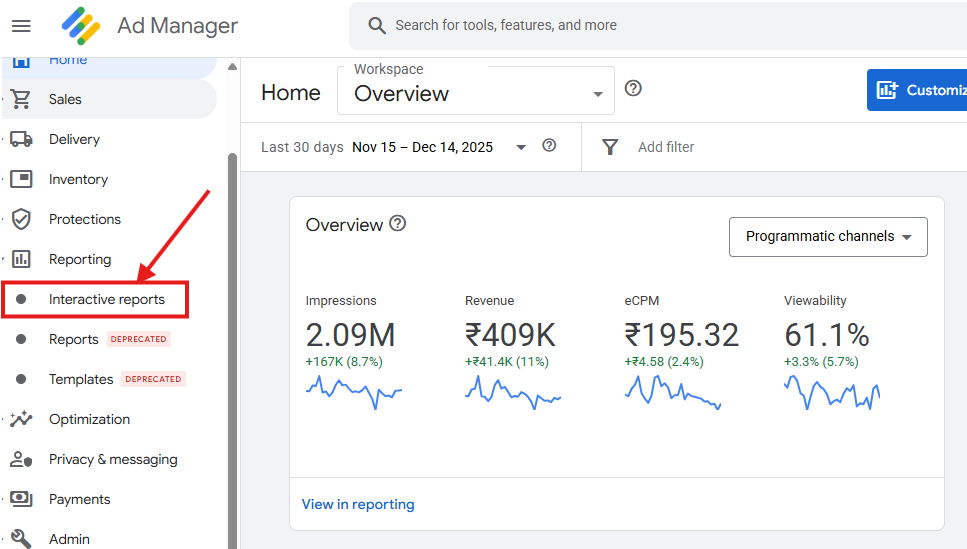
- Go to Reporting
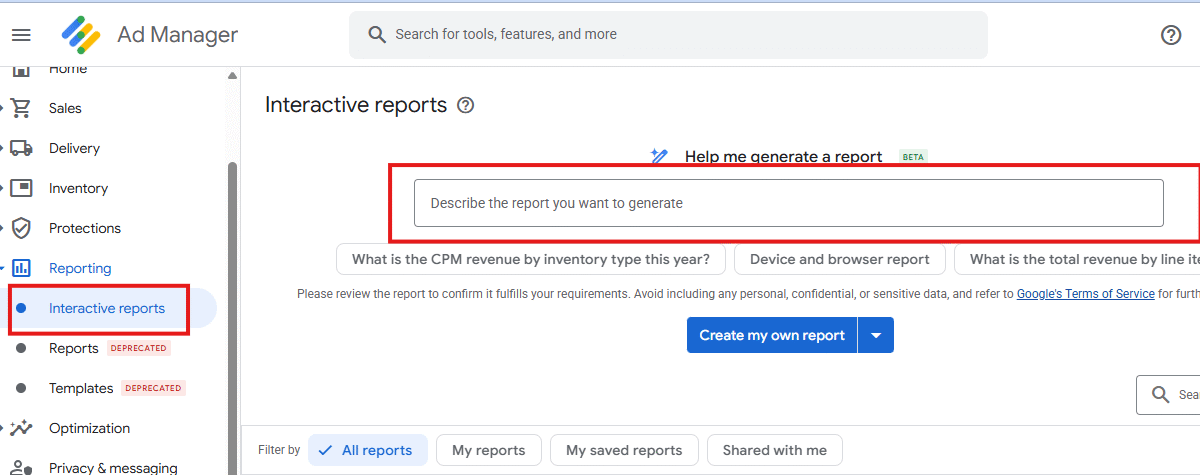
- Click Interactive Reports
- Choose:
- “Create my own report”
- Or use suggested templates
- Select your metrics:
- Revenue
- Impressions
- eCPM
- Fill rate
- Add dimensions:
- Ad unit
- Country
- Device
- Demand source
- Apply filters if needed
- View results instantly
No processing delay.
No downloads.
No frustration.
This is the biggest shift in Google Ad Manager reporting in years.
Why Interactive Reports Are Easier Than Traditional Reports
Here’s the honest reason.
Interactive reports don’t force you to think ahead.
With traditional reports, you must decide:
“What if I need this breakdown later?”
With Interactive Reports:
You just click and explore.
They’re easier because:
- You don’t rebuild reports
- You don’t lose context
- You don’t jump between tools
- You notice trends visually
Once publishers use this daily, going back feels impossible.
Saving and Scheduling Interactive Reports
This is where confusion usually happens.
How Saving Works
- After creating a report view
- Click Save
- Give it a clear name
- Access it anytime under “My saved reports”
Saved reports keep:
- Dimensions
- Metrics
- Filters
What About Scheduling?
Interactive reports themselves aren’t email-scheduled like old reports.
But:
- Saved views load instantly
- Monetiscope teams convert insights into action workflows
- Traditional scheduled reports can still be used for finance
Most serious publishers now use:
- Interactive Reports → Optimization
- Scheduled Reports → Accounting
Where Interactive Reports Make the Biggest Impact
Here’s where publishers see instant value.
1. Revenue Monitoring
Quickly detect:
- Sudden revenue drops
- Geo-level anomalies
- Demand fluctuations
2. Floor Price Decisions
Analyze:
- eCPM vs fill trade-offs
- Floor impact by country
- Revenue leakage points
3. Demand Partner Performance
Understand:
- Which buyers perform where
- Time-based variations
- Inventory quality signals
4. Ad Unit Optimization
Identify:
- Low-performing placements
- High-value hidden inventory
- UX-damaging ad units
How Monetiscope Helps Publishers Use Interactive Reports Properly
Here’s the real problem most publishers face.
They can see data.
But they don’t know what action to take.
This is where Monetiscope adds value.
What Monetiscope Actually Does
- Builds custom Interactive Report views
- Identifies hidden revenue leaks
- Maps KPIs to monetization actions
- Optimizes AdX floors using report signals
- Tracks fill, eCPM, and viewability trends
- Turns reports into revenue strategy
We don’t just look at numbers.
We translate them into outcomes.
Many publishers see 20–30% revenue uplift simply by acting faster on Interactive Report insights.
Why Interactive Reports Matter for AdX Monetization
If you’re using:
- Google AdX
- Open Bidding
- Programmatic demand
Then slow reporting costs real money.
New Interactive Reports in Google Ad Manager help you:
- Protect eCPM
- Balance fill vs revenue
- Catch demand issues early
- Scale without risk
This is no longer optional.
It’s part of modern ad operations.
Final Thoughts: This Is the New Standard for GAM Reporting
Google is sending a clear signal.
Reporting is moving:
From static → interactive
From delayed → instant
From reactive → proactive
Publishers who adapt early win quietly.
Others keep exporting CSVs and reacting late.
If you want to use Interactive Reports properly and turn insights into revenue, Monetiscope can help.
FAQs: Interactive Reports in Google Ad Manager
What are Interactive Reports in Google Ad Manager?
They are live, flexible reports for instant data analysis inside GAM.
Are Interactive Reports free?
Yes. They are included in Google Ad Manager.
Can Interactive Reports replace traditional reports?
No. They are best for optimization, not accounting.
Are Interactive Reports real-time?
They are near real-time based on Google data refresh.
Can I export Interactive Reports?
Yes, but most insights are used directly inside GAM.
Are Interactive Reports useful for AdX optimization?
Yes. They are ideal for floor, demand, and geo analysis.
Can I save Interactive Reports?
Yes. You can save custom report views.
Do Interactive Reports support multiple dimensions?
Yes. Country, device, ad unit, buyer, and more.
Does Monetiscope help with Interactive Reports?
Yes. Monetiscope helps publishers act on report insights.
Should publishers stop using traditional reports?
No. Use Interactive Reports for optimization and traditional reports for records.